Scaling LangGraph, LlamaIndex, and CrewAI, Part 2: Load, Inference, and Authorization
By Alexander Chernov. First published on LinkedIn, 2026-11-15. Read the original.
Part 2 of two on scaling agent frameworks. Part 1 was state and recovery. This part is load, inference, and authorization.
An agent platform scales when each workload has its own pool and its own scaling signal, and when limits and authorization sit outside the framework. Limits need the same care as any other distributed state. In a rate-limit test, one LiteLLM key got three times its limit through three proxy instances while their shared Redis was down. Set to fail closed, the same outage let none through.
Part 1 showed that LangGraph, LlamaIndex, and CrewAI define what an agent workflow does and leave the distributed system that runs it to the platform, and that recovery needs a stable idempotency key saved before each side effect. Every framework capability below is stated as its vendor documents it, read on 2026-11-05. The measured result comes from the LiteLLM test, described below, and from my published work, each named where it appears.
Separate orchestration from execution
A graph executor spends most of its time waiting on LLM inference, REST and gRPC calls, database queries, vector search, MCP tools, human approvals, and external jobs. These have different resource profiles, so more executor replicas may add no useful throughput. LangChain’s documentation says that added queue workers “will increase run throughput linearly,” each executing N_JOBS_PER_WORKER concurrent runs, 10 by default. That describes run slots. A slot waiting on a saturated model server completes nothing faster.
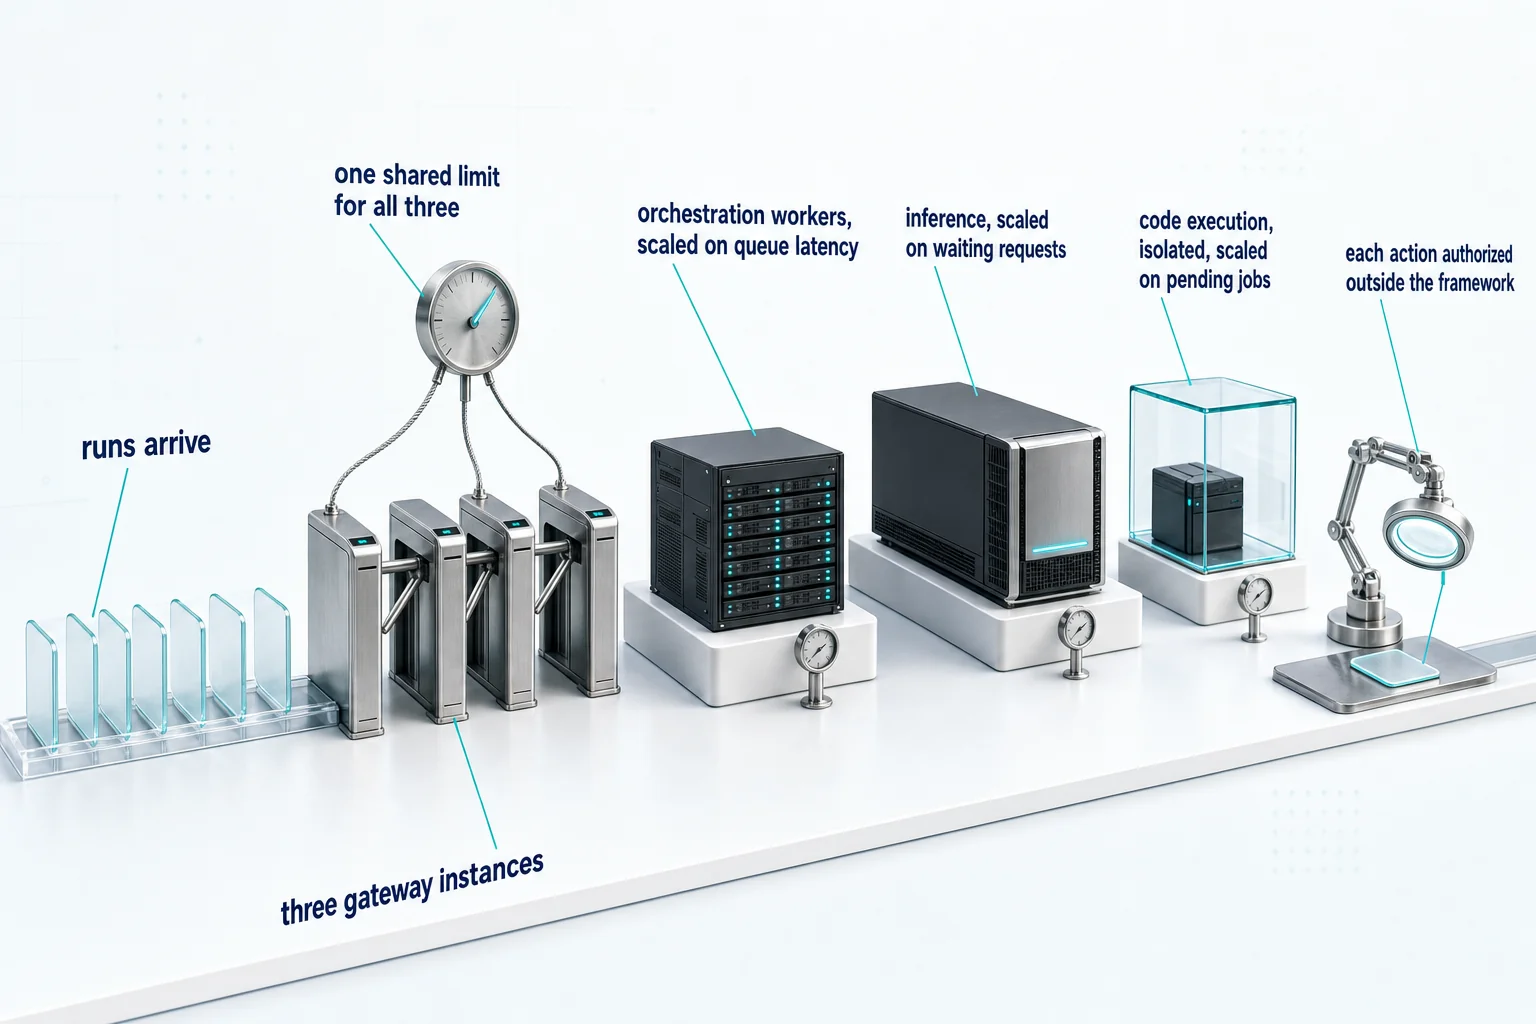
The better design gives each workload its own pool and its own scaling signal:
- Graph orchestration: CPU-based asynchronous workers, scaled on active runs and queue latency.
- Retrieval: search services, scaled on query concurrency and latency.
- MCP tools: independent services, scaled on requests and queue backlog.
- Code execution: isolated Kubernetes jobs, scaled on pending jobs and sandbox capacity.
- LLM inference: GPU-backed serving, scaled on waiting requests, token throughput, and memory pressure.
- Human approval: durable state and notifications, tracked by pending approvals and their age.
The Kubernetes Horizontal Pod Autoscaler handles CPU and memory. KEDA feeds it external metrics such as queue length, and it can scale an idle worker pool to zero. GPU inference needs its own signals: the vLLM production stack’s KEDA guide triggers on vllm:num_requests_waiting, and vllm:kv_cache_usage_perc reports cache pressure. An agent waiting for an approval or a tool response should not occupy expensive GPU resources.
Control fan-out and backpressure
Agent frameworks amplify load. One request can trigger four retrieval operations and three specialist agents, each with two reasoning iterations and several tool calls per iteration. CrewAI’s documented defaults show the ceiling: an agent gets 20 iterations before it must give its best answer, so three agents at one task each may reach 60. max_rpm is optional. Without explicit limits, this amplification overloads the model server, the vector database, and external tools.
I would enforce limits at every level: global capacity → tenant quota → workflow budget → node concurrency limit → tool or model capacity. In practice that means maximum active runs per tenant, concurrent inference requests, graph fan-out, tokens per workflow, retries per operation, execution duration, concurrent retrieval queries, and sandbox jobs.
Request rate alone cannot size an agentic platform. As an illustrative average: 50 runs per second × 8 model calls per run = 400 model calls per second, and 400 calls per second × 800 output tokens per call = 320,000 output tokens per second. That excludes input processing, retry amplification, bursts, and scheduling overhead. Actual sizing also depends on model architecture, hardware, batching, prompt lengths, and latency targets.
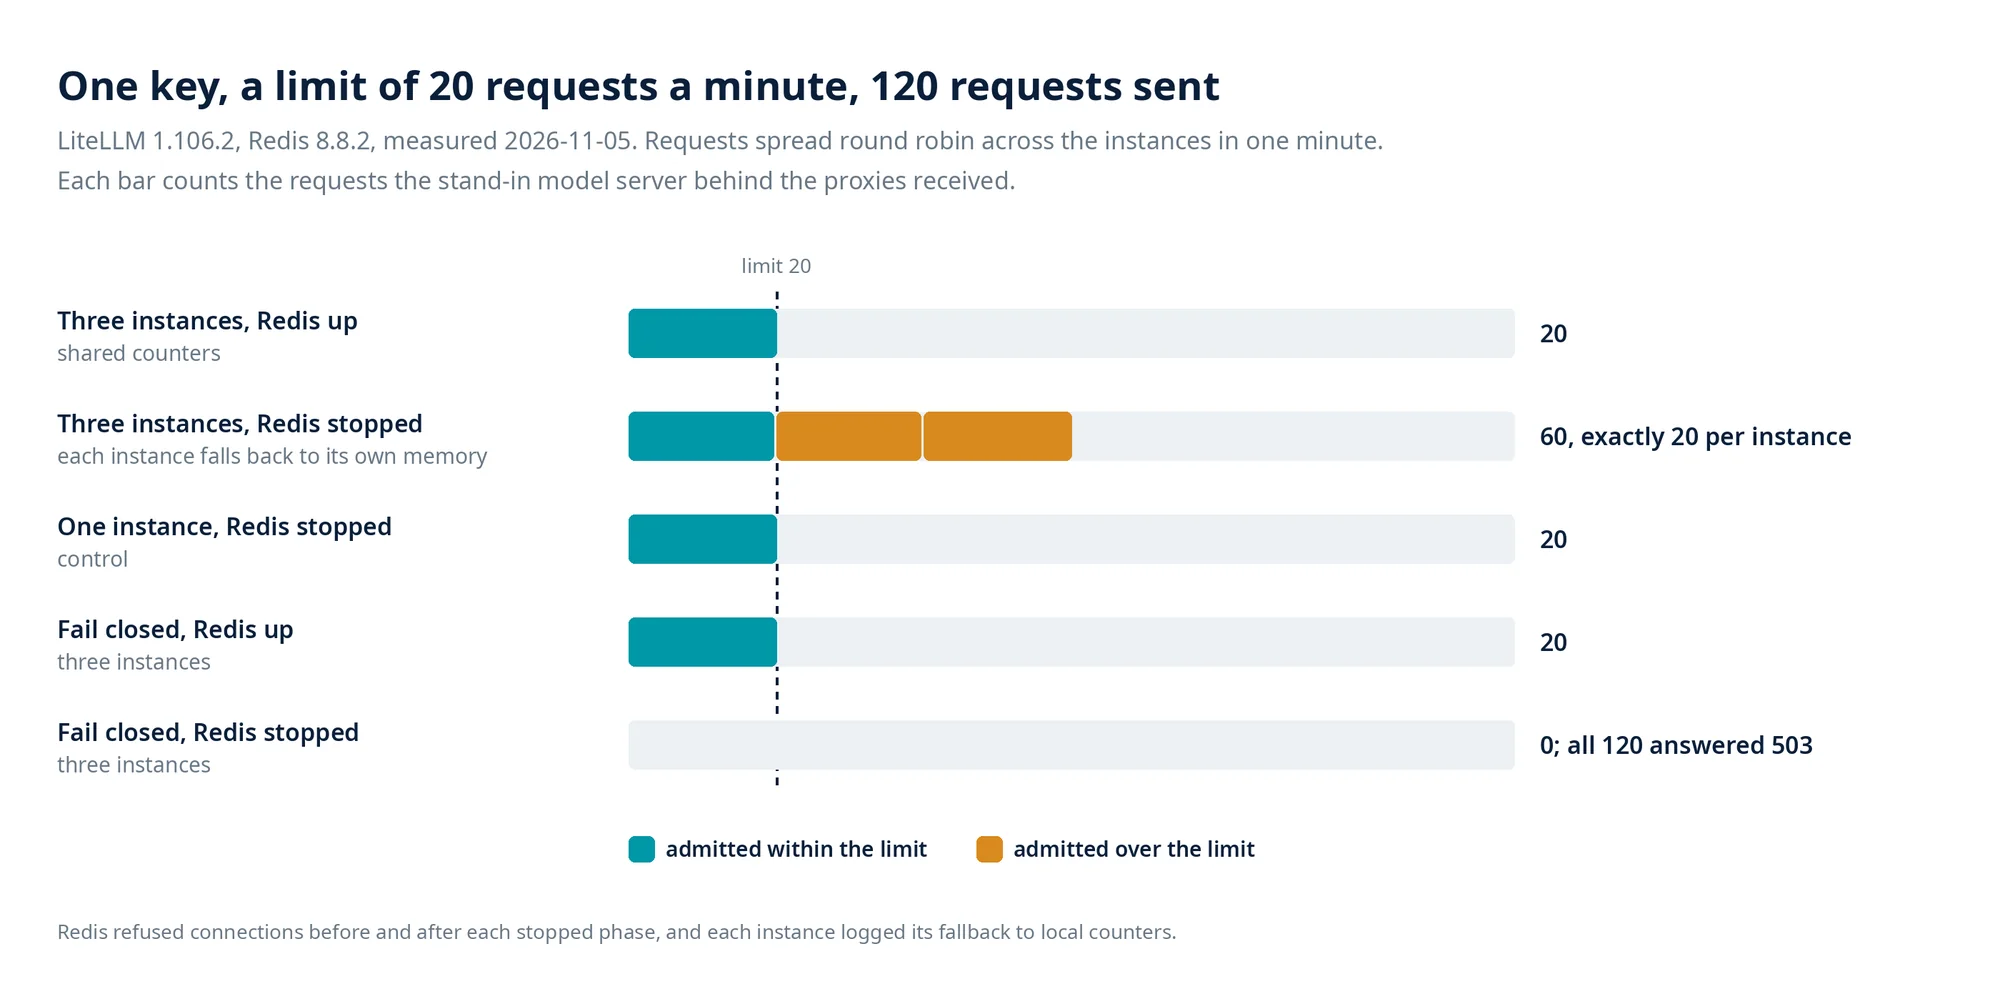
Limits are themselves distributed state. LiteLLM’s documentation shows why: counters are shared through Redis, and while Redis is unreachable each instance falls back to its own memory and keeps serving, so a key is admitted up to “N times the limit across N instances” unless the deployment opts to fail closed.
A rate-limit test with LiteLLM 1.106.2 gives the numbers. One key limited to 20 requests per minute received 120 requests in a minute, spread across three proxy instances: with Redis up, 20 got through; with Redis stopped, 60, exactly 20 per instance; a single instance with Redis stopped admitted 20. With fail_closed_rate_limit_enforcement on, the same outage admitted none and answered all 120 with a 503, and with Redis up the setting changed nothing.
Inference as a separate tier
Inference divides into three layers, and they should not share a scaling lifecycle:
- LLM gateway: model routing, authentication, tenant quotas, API compatibility, usage accounting, provider fallback, request-level observability, and cost management. LiteLLM is one option, with budgets and limits per key, team, and user.
- Inference backend: model execution, continuous batching, KV-cache management, GPU utilization, tensor and pipeline parallelism where needed, and scheduling. vLLM is one option. Its design documentation defines the saturation point to watch as “the inflection point where we cannot get more throughput with a higher request rate, but start to incur additional latency.”
- Agent orchestration: which model to invoke, which context and tools to provide, how to interpret results, and whether to stop, continue, or escalate.
A platform can route across model classes after task classification. A small model handles classification, tool selection, and simple extraction. A medium model handles routine reasoning and structured synthesis. A large model handles complex reasoning, difficult planning, and high-ambiguity tasks. This improves inference efficiency only if routing quality is validated.
Model selection is not authorization. A routing model may choose a capable tool, and an independent policy layer must decide whether the requested operation is permitted.
Semantic caching reduces inference cost, but similarity alone does not establish correctness. A reusable answer must satisfy constraints on tenant identity, authorization context, source version, data freshness, query semantics, policy compatibility, and provenance. Regulated environments should make cache admission explicit rather than rely on an embedding similarity threshold. My article “The Semantic Cache Is Where Cost, Governance and Security Meet” covers this with measured results.
Isolation and runtime authorization
Code running in production differs from an autonomous agent acting in production. Conventional software follows explicitly implemented decision paths. An agent generates plans dynamically and selects tools from model output.
Isolation should match the risk of what runs:
- Trusted internal service: a conventional container.
- Restricted tool service: a dedicated service account and a network policy.
- Untrusted code: gVisor or a hardened sandbox.
- Higher-risk untrusted execution: Kata Containers or a Firecracker-backed VM.
- Sensitive operation: a dedicated executor with narrow authorization.
These choices trade startup latency, compatibility, isolation guarantees, and infrastructure cost. Kubernetes now has a project for this workload. Agent Sandbox, from SIG Apps, supports gVisor and Kata Containers as runtimes, and its SandboxWarmPool keeps pre-provisioned pods ready to reduce cold starts.
Workload policy and action authorization are separate decisions. Kyverno can require approved images, non-root execution, resource limits, security contexts, and namespace restrictions when a workload is admitted. An admission policy of that kind does not decide whether one tool call from a running agent, with its arguments, is authorized now.
That second decision belongs to a runtime policy service in the style of OPA or Cedar. It evaluates four groups of attributes:
- Subject: tenant, user, and agent.
- Action: operation, tool, and parameters.
- Resource: target, classification, and environment.
- Context: approval, risk, and policy version.
The enforcement point must sit outside the LLM’s control. An agent that proposes deleting a Kubernetes namespace should not hold unrestricted Kubernetes credentials. The path is agent proposal → policy evaluation → approval if required → authorized executor → Kubernetes API → execution receipt, and the executor independently verifies that the operation is still authorized.
Admission outside the framework: Brain API
Brain API is an intent-aware control plane that places this decision outside any one framework: LangGraph or CrewAI → proposed action → Brain API → policy admission → authorized executor → external operation. Its responsibilities are intent interpretation, candidate evaluation, capability selection, policy admission, human escalation, and decision provenance. Each decision produces a decision artifact, a durable and versioned record of which policies applied, which capabilities were evaluated, which alternatives were rejected, and why.
Keeping authorization outside the framework lets several orchestration technologies share one admission model.
The Brain API prototype agrees with the OPA Gatekeeper constraint library’s own published verdicts on 42 of 42 encodable cases, 19 admit and 23 deny.
The same separation changes results in software delivery. In “Agents Propose, a Gate Decides,” of 19 release cases that should not get through, a standard cosign and Kyverno configuration admitted 11, and a gate placed across the whole chain stopped 18.
Observability and failure injection
Application monitoring alone is insufficient for agent workflows. The platform needs metrics in eight categories:
- Traffic: runs per second, active runs, arrival rate.
- Latency: end-to-end p50, p95, and p99, queue latency, time to first token.
- Inference: tokens per second, GPU utilization, KV-cache pressure.
- State: checkpoint latency, recovery time, database connection utilization.
- Reliability: failures, retries, abandoned runs, duplicate effects.
- Security: unauthorized actions executed, policy evaluation failures.
- Quality: task success, tool-selection accuracy, groundedness, retrieval recall.
- Cost: cost per successful task, tokens per run, GPU-hours.
OpenTelemetry can correlate the path: user request → graph run → graph node → model invocation → tool invocation → policy decision → external operation → checkpoint. Its generative AI conventions already name invoke_agent, chat, and execute_tool spans. Useful correlation identifiers are trace_id, tenant_id, conversation_id, run_id, step_id, attempt_id, and tool_call_id. Sensitive content should be protected or omitted, and the OpenTelemetry project’s own walkthrough leaves prompt content and tool arguments out by default.
Correct recovery has to be established by testing. Successful execution under normal conditions proves nothing about it. The test set should include worker termination, broker redelivery, database failover, partial tool execution, model timeout, network partition, authorization-service failure, checkpoint write failure, duplicate messages, and a deployment while workflows are suspended.
From 100 to 100,000 concurrent runs
These are architectural stages, not framework capacity guarantees:
- 100 concurrent runs: replicated API and graph workers with PostgreSQL checkpoints. The main challenge is state correctness.
- 1,000: dedicated execution queues, KEDA, and external tools. The main challenges are backpressure and recovery.
- 10,000: independent workload pools, quotas, and partitioned queues. The main challenge is resource contention.
- 100,000: distributed scheduling, admission control, and sharded state. The main challenges are coordination and fault domains.
Partitioning brings a measurement trap. In “At 100,000 Devices, Throughput Is the Easy Part,” going from 16 partitions to 1,024 improved the cluster average by exactly 64x and the saturated partition by a factor of 1.25. A partitioned agent queue should be judged on its hottest partition, not its mean.
The number of concurrent workflow instances is not the number of active inference requests. A hundred thousand workflows waiting for human approval are mostly durable state, and they need no hundred thousand containers. A hundred thousand workflows generating tokens at once need substantial inference capacity, network traffic, checkpoint operations, and tool concurrency. Capacity planning should count running, queued, waiting, and suspended work separately.
Horizontal scale and workflow complexity
Scaling has two dimensions:
- Horizontal scale: more independent workflow instances, meaning more users, sessions, graph workers, and independent tool calls. This is a distributed execution and capacity problem.
- Workflow complexity: more inside one workflow, meaning more nodes, branches, specialist agents, history, context, retries, and larger intermediate results. This creates state growth, coordination overhead, error propagation, inconsistent decisions, harder debugging, tail latency, and weaker reproducibility.
Adding Kubernetes replicas does not resolve the second dimension. Poorly constrained workflow complexity can overwhelm an otherwise well-scaled infrastructure.
Seven tradeoffs
Each choice should be settled with workload-specific measurements rather than a universal preference:
- Monolithic graph or distributed services: simple deployment and centralized logic, against isolation and independent scaling at greater operational complexity.
- Synchronous or asynchronous execution: straightforward programming and low coordination, against better resilience and utilization with more complex state.
- Frequent or infrequent checkpoints: finer recovery with more database writes, against lower overhead with more replay.
- Central orchestration or event-driven choreography: visibility and easier audit with a potential bottleneck, against decoupling with harder global reasoning.
- Multiple agents or a single agent: specialization with more model calls and coordination, against simpler state with less explicit specialization.
- Shared or tenant-dedicated pools: efficient utilization with noisy neighbors, against stronger isolation at lower utilization and higher cost.
- Managed or self-hosted inference: lower operational burden with less control, against control and optimization with GPU operations and capacity management.
A hybrid architecture
I would not implement every part of the system in one framework. Each component has a job:
- LangGraph: high-level workflow coordination, conditional branching, approval interrupts, long-running state transitions, and checkpoint-based recovery.
- LlamaIndex: data ingestion, retrieval pipelines, document processing, SQL and vector search, and evidence-grounded synthesis.
- CrewAI: selective use for specialist collaboration, research and review workflows, and multi-role problem solving.
- Rust services: security-sensitive tool execution, high-throughput MCP services, typed internal contracts, policy enforcement points, and performance-critical infrastructure operations.
- Infrastructure: Kubernetes for scheduling and isolation, KEDA for event-driven autoscaling, Kafka or NATS JetStream for durable asynchronous work, PostgreSQL for authoritative state, Redis where ephemeral coordination is justified, S3-compatible storage for artifacts, LiteLLM as the gateway, vLLM for self-hosted inference, OpenTelemetry for tracing, Kyverno for Kubernetes policy, and OPA or Cedar services for action-level authorization.
One execution path through it: client → API gateway → LangGraph → durable queue → Rust or Python executor → policy admission → MCP or gRPC tool → external system → execution receipt → PostgreSQL checkpoint → graph continuation. The framework stays responsible for workflow semantics, and the surrounding platform owns the operational guarantees.
Where to start
For an enterprise agent platform, I would start with LangGraph, independently deployed Rust and Python services, PostgreSQL, durable asynchronous messaging, and Kubernetes. LlamaIndex can complement that for data-centric retrieval, and CrewAI can come in where specialist collaboration produces measurable benefits. I would not introduce a complex distributed architecture before the operational requirements are established.
The sequence I would follow has eight steps:
- Implement a small, correct workflow with durable state.
- Establish idempotent and authorized tool execution.
- Test crash recovery, replay, and reconciliation.
- Add observability and baseline evaluation.
- Measure throughput, latency, and resource bottlenecks.
- Separate components with different scaling characteristics.
- Introduce workload-specific autoscaling and admission controls.
- Validate the architecture under realistic load and fault injection.
Separating the graph framework from the execution platform changes what capacity planning measures. The number stops being how many agents can run, and becomes how many tasks complete correctly, safely, and economically under load and failure.
Sources
- LangChain, “Scalability and resilience,” LangSmith documentation. https://docs.langchain.com/langsmith/scalability-and-resilience
- CrewAI, “Agents.” https://docs.crewai.com/en/concepts/agents
- KEDA, “KEDA Concepts.” https://keda.sh/docs/latest/concepts/
- vLLM, “Metrics,” design documentation. https://docs.vllm.ai/en/latest/design/metrics/
- vLLM production-stack, “Autoscaling with KEDA.” https://docs.vllm.ai/projects/production-stack/en/latest/use_cases/autoscaling-keda.html
- LiteLLM, “Budgets, Rate Limits.” https://docs.litellm.ai/docs/proxy/users
- Kyverno, “Introduction.” https://kyverno.io/docs/introduction/
- Kubernetes Blog, “Running Agents on Kubernetes with Agent Sandbox,” 2026-03-20. https://kubernetes.io/blog/2026/03/20/running-agents-on-kubernetes-with-agent-sandbox/
- OpenTelemetry Blog, “Inside the LLM Call: GenAI Observability with OpenTelemetry,” 2026. https://opentelemetry.io/blog/2026/genai-observability/
- A. Chernov, “Brain API: An Intent-Aware Control Plane for Policy-Governed Agentic Systems,” arXiv:2609.21299, 2026. https://arxiv.org/abs/2609.21299
- A. Chernov, “Agents Propose, a Gate Decides: Governed Delivery for Agent-Written Software,” 2026. https://www.linkedin.com/pulse/agents-propose-gate-decides-governed-delivery-software-chernov-fi9cc/
- A. Chernov, “The Semantic Cache Is Where Cost, Governance and Security Meet,” 2026. https://www.linkedin.com/pulse/semantic-cache-where-cost-governance-security-meet-alexander-chernov-p5vlc/
- A. Chernov, “At 100,000 Devices, Throughput Is the Easy Part,” 2026. https://www.linkedin.com/pulse/100000-devices-throughput-easy-part-alexander-chernov-tz7bc/
- A. Chernov, “Scaling LangGraph, LlamaIndex, and CrewAI, Part 1: State and Recovery,” 2026. https://www.linkedin.com/pulse/scaling-langgraph-llamaindex-crewai-part-1-state-recovery-chernov-msshc/
Every link above was checked on 2026-11-06.
#AgenticAI #AIAgents #LangGraph #Kubernetes #PlatformEngineering #vLLM #LiteLLM #KEDA #OpenTelemetry #PolicyAsCode #AIGovernance #BrainAPI
© 2026 Alexander Chernov. All rights reserved. First published on LinkedIn, which remains the canonical version; this page is a reprint by the author.